Modern logo for IM Design featuring a minimalistic black 'im' with a coral dot above the 'i' and the word 'design' vertically aligned on the right.

Context

At La Ruche Qui Dit Oui, Hosts play a key role in managing product distributions and engaging with members. However, they faced challenges in effectively accessing and interpreting key platform data.

To better understand these challenge, we conducted 10+ in-depth interviews with Hosts to identify pain points, priorities, and workflows. We also collected and analyzed feedback from the Operations team to uncover recurring trends and challenges.

Screenshot of a collaborative board showing user feedback, recommendations, and a prioritization matrix for the La Ruche Qui Dit Oui! project.

Insights

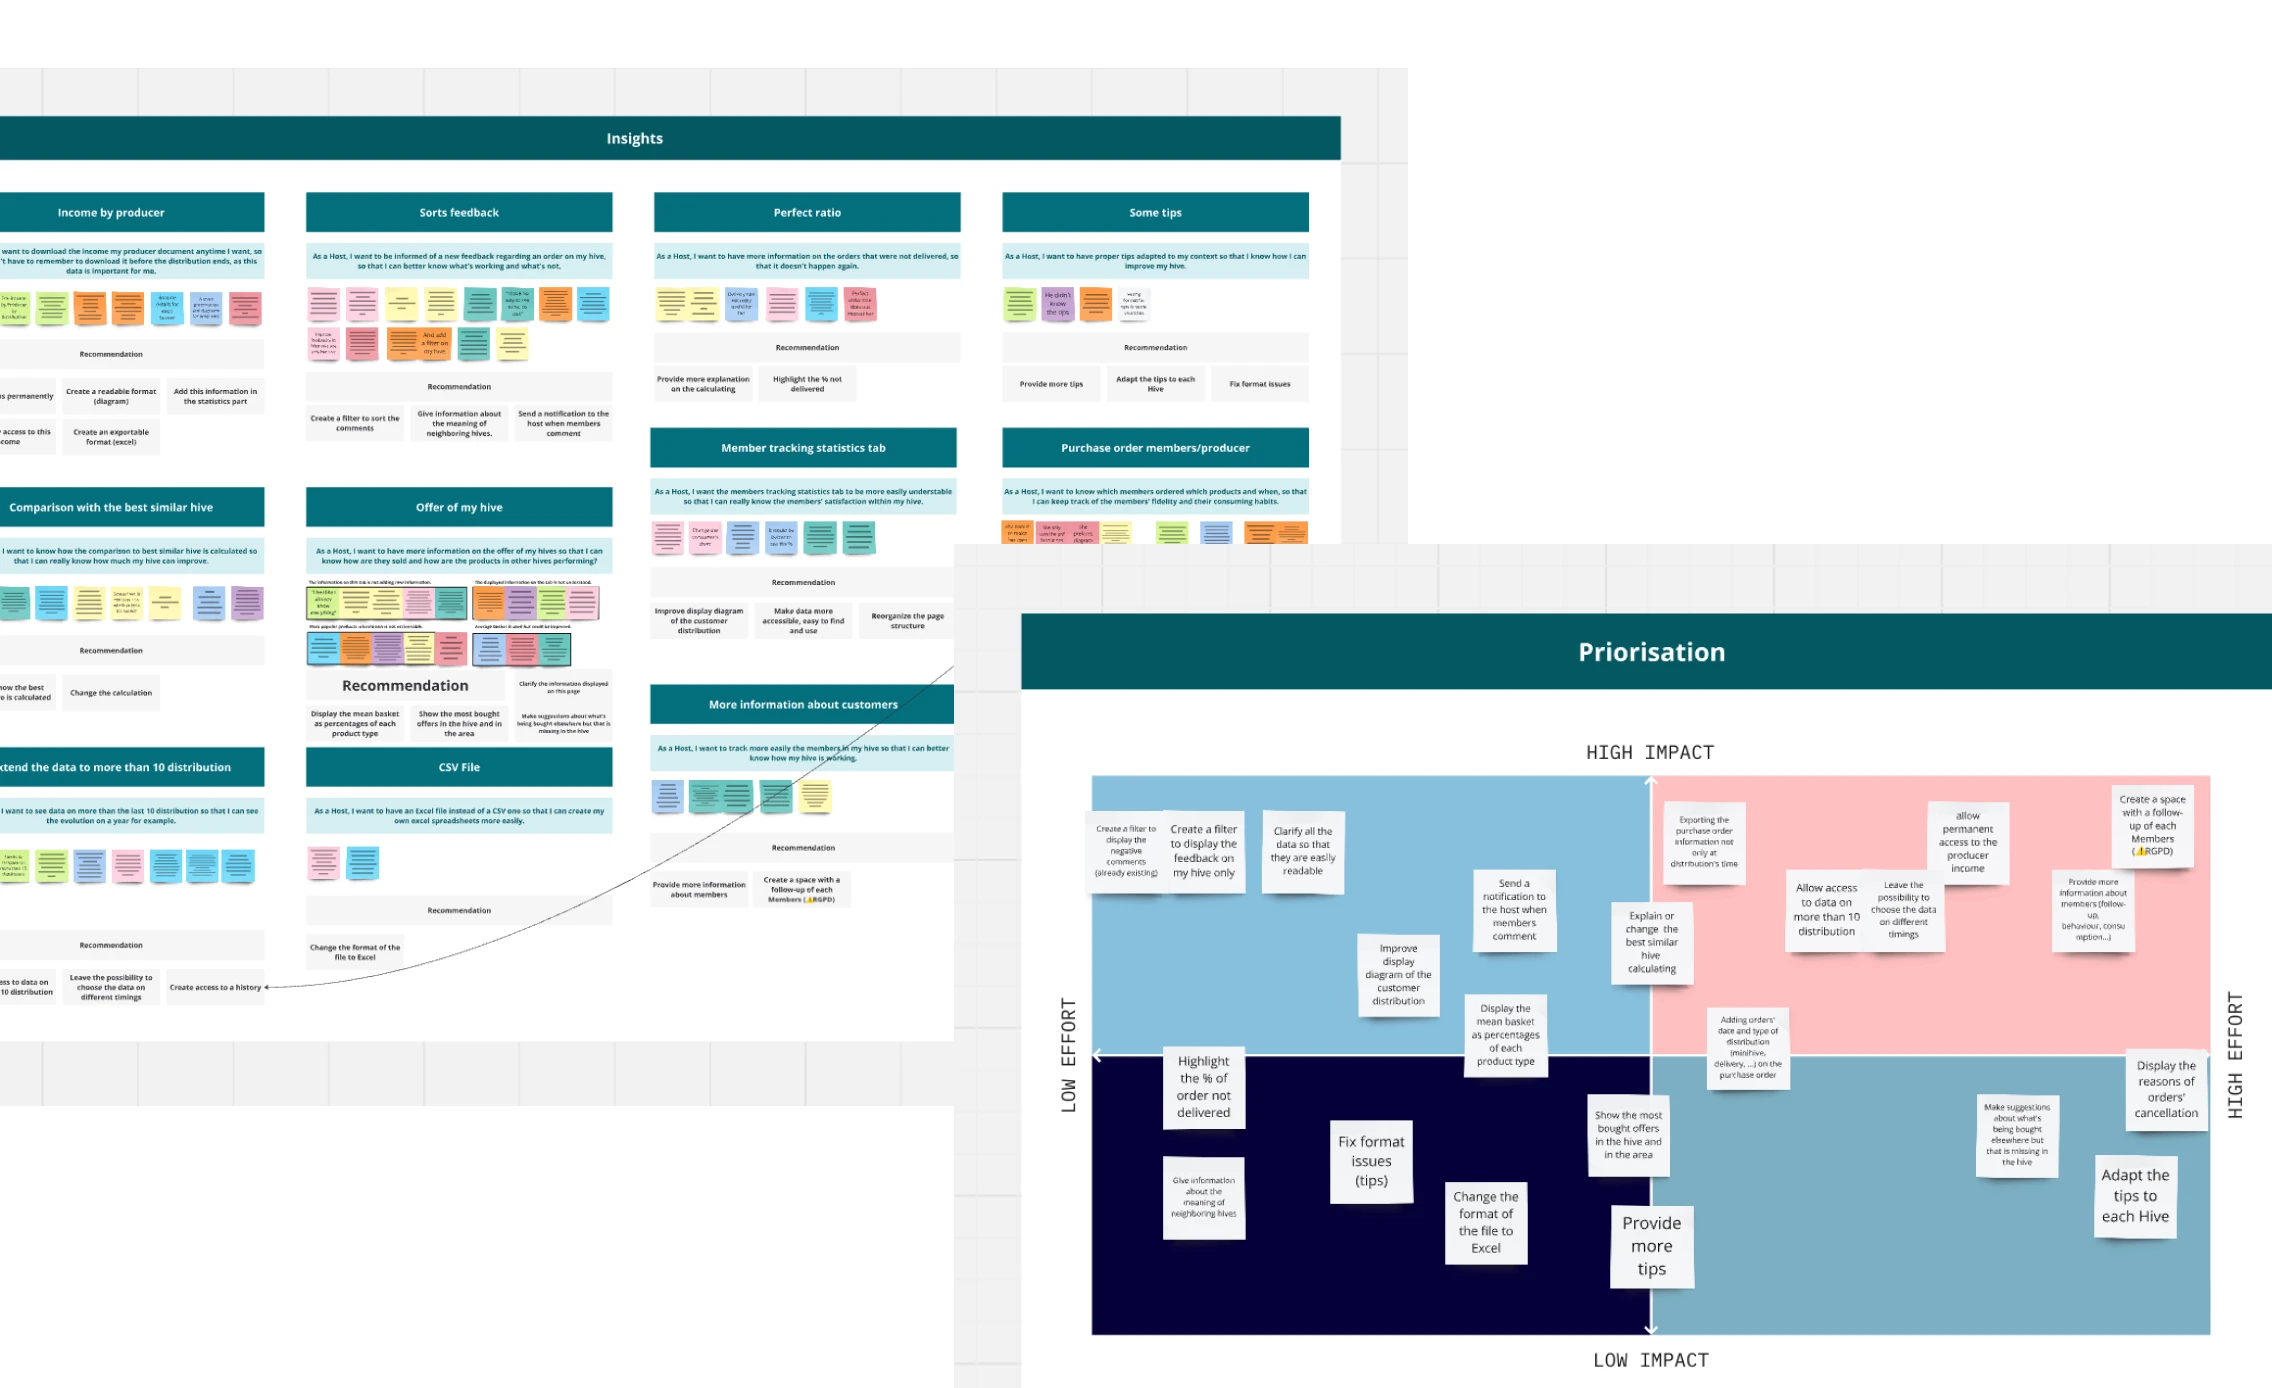
Based on our research, we identify the mains problems they have, and we prioritized using the impact vs. effort matrix:


  • Hosts couldn’t isolate member reviews relevant to their Ruche

  • Data visibility was limited to the last 10 distributions

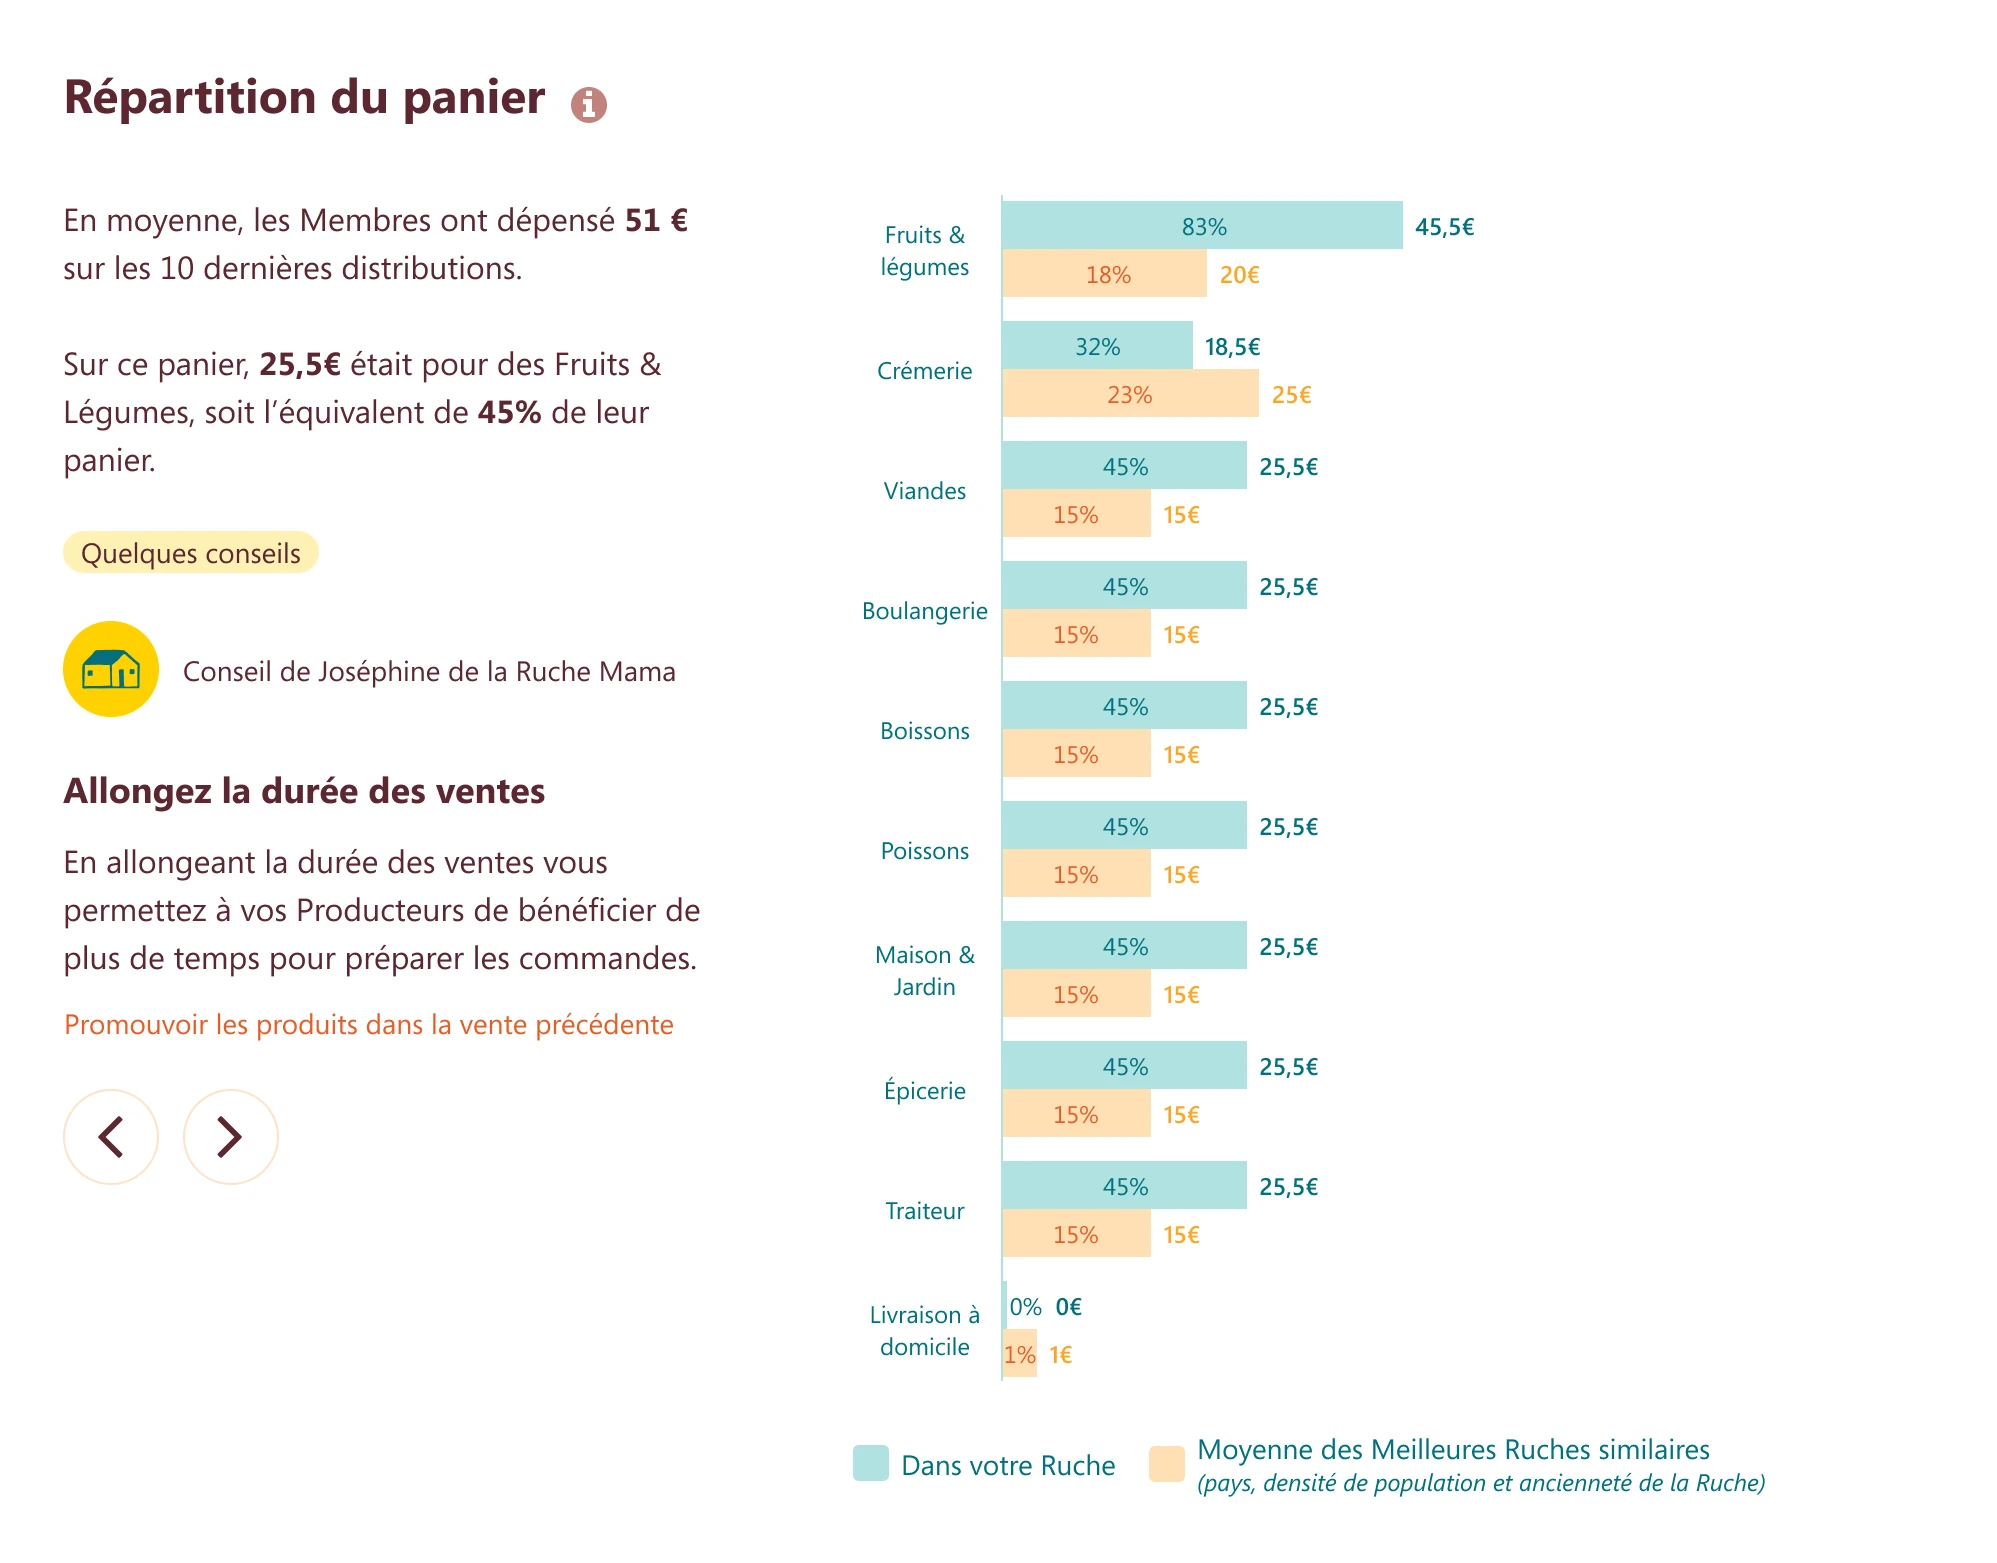
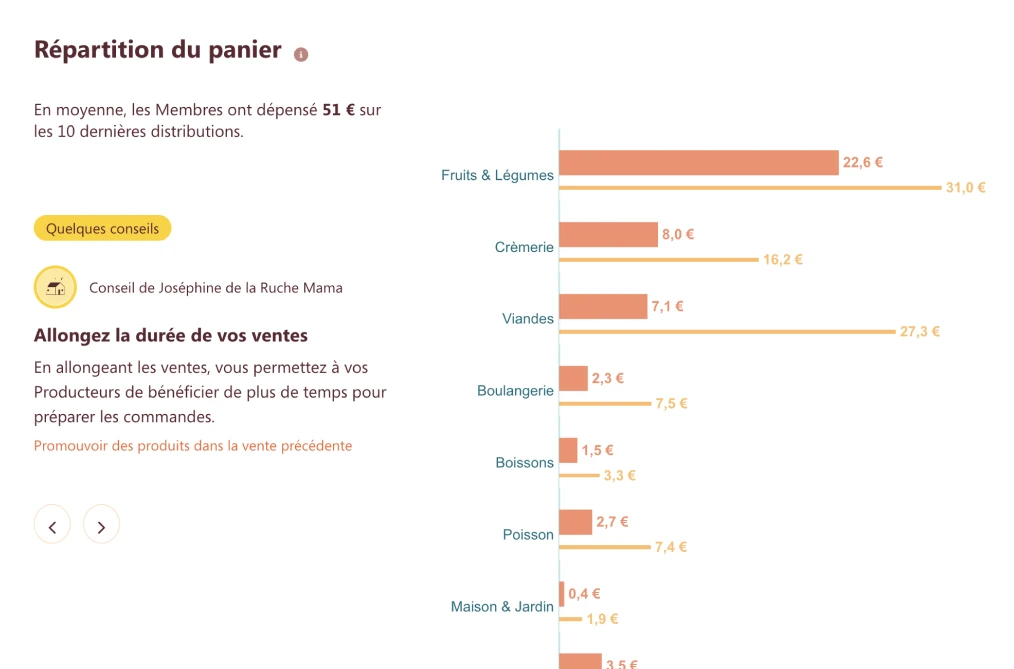
  • Existing basket diagrams were unclear and difficult to interpret

Screenshot of the La Ruche Qui Dit Oui! interface showing featured products and their comments, and highlighting a toggle labeled  “Only reviews about my Hive”.
Screenshot of La Ruche Qui Dit Oui! interface showing a notification dated 06/21/2019 that a member left a review on a Ferme product.

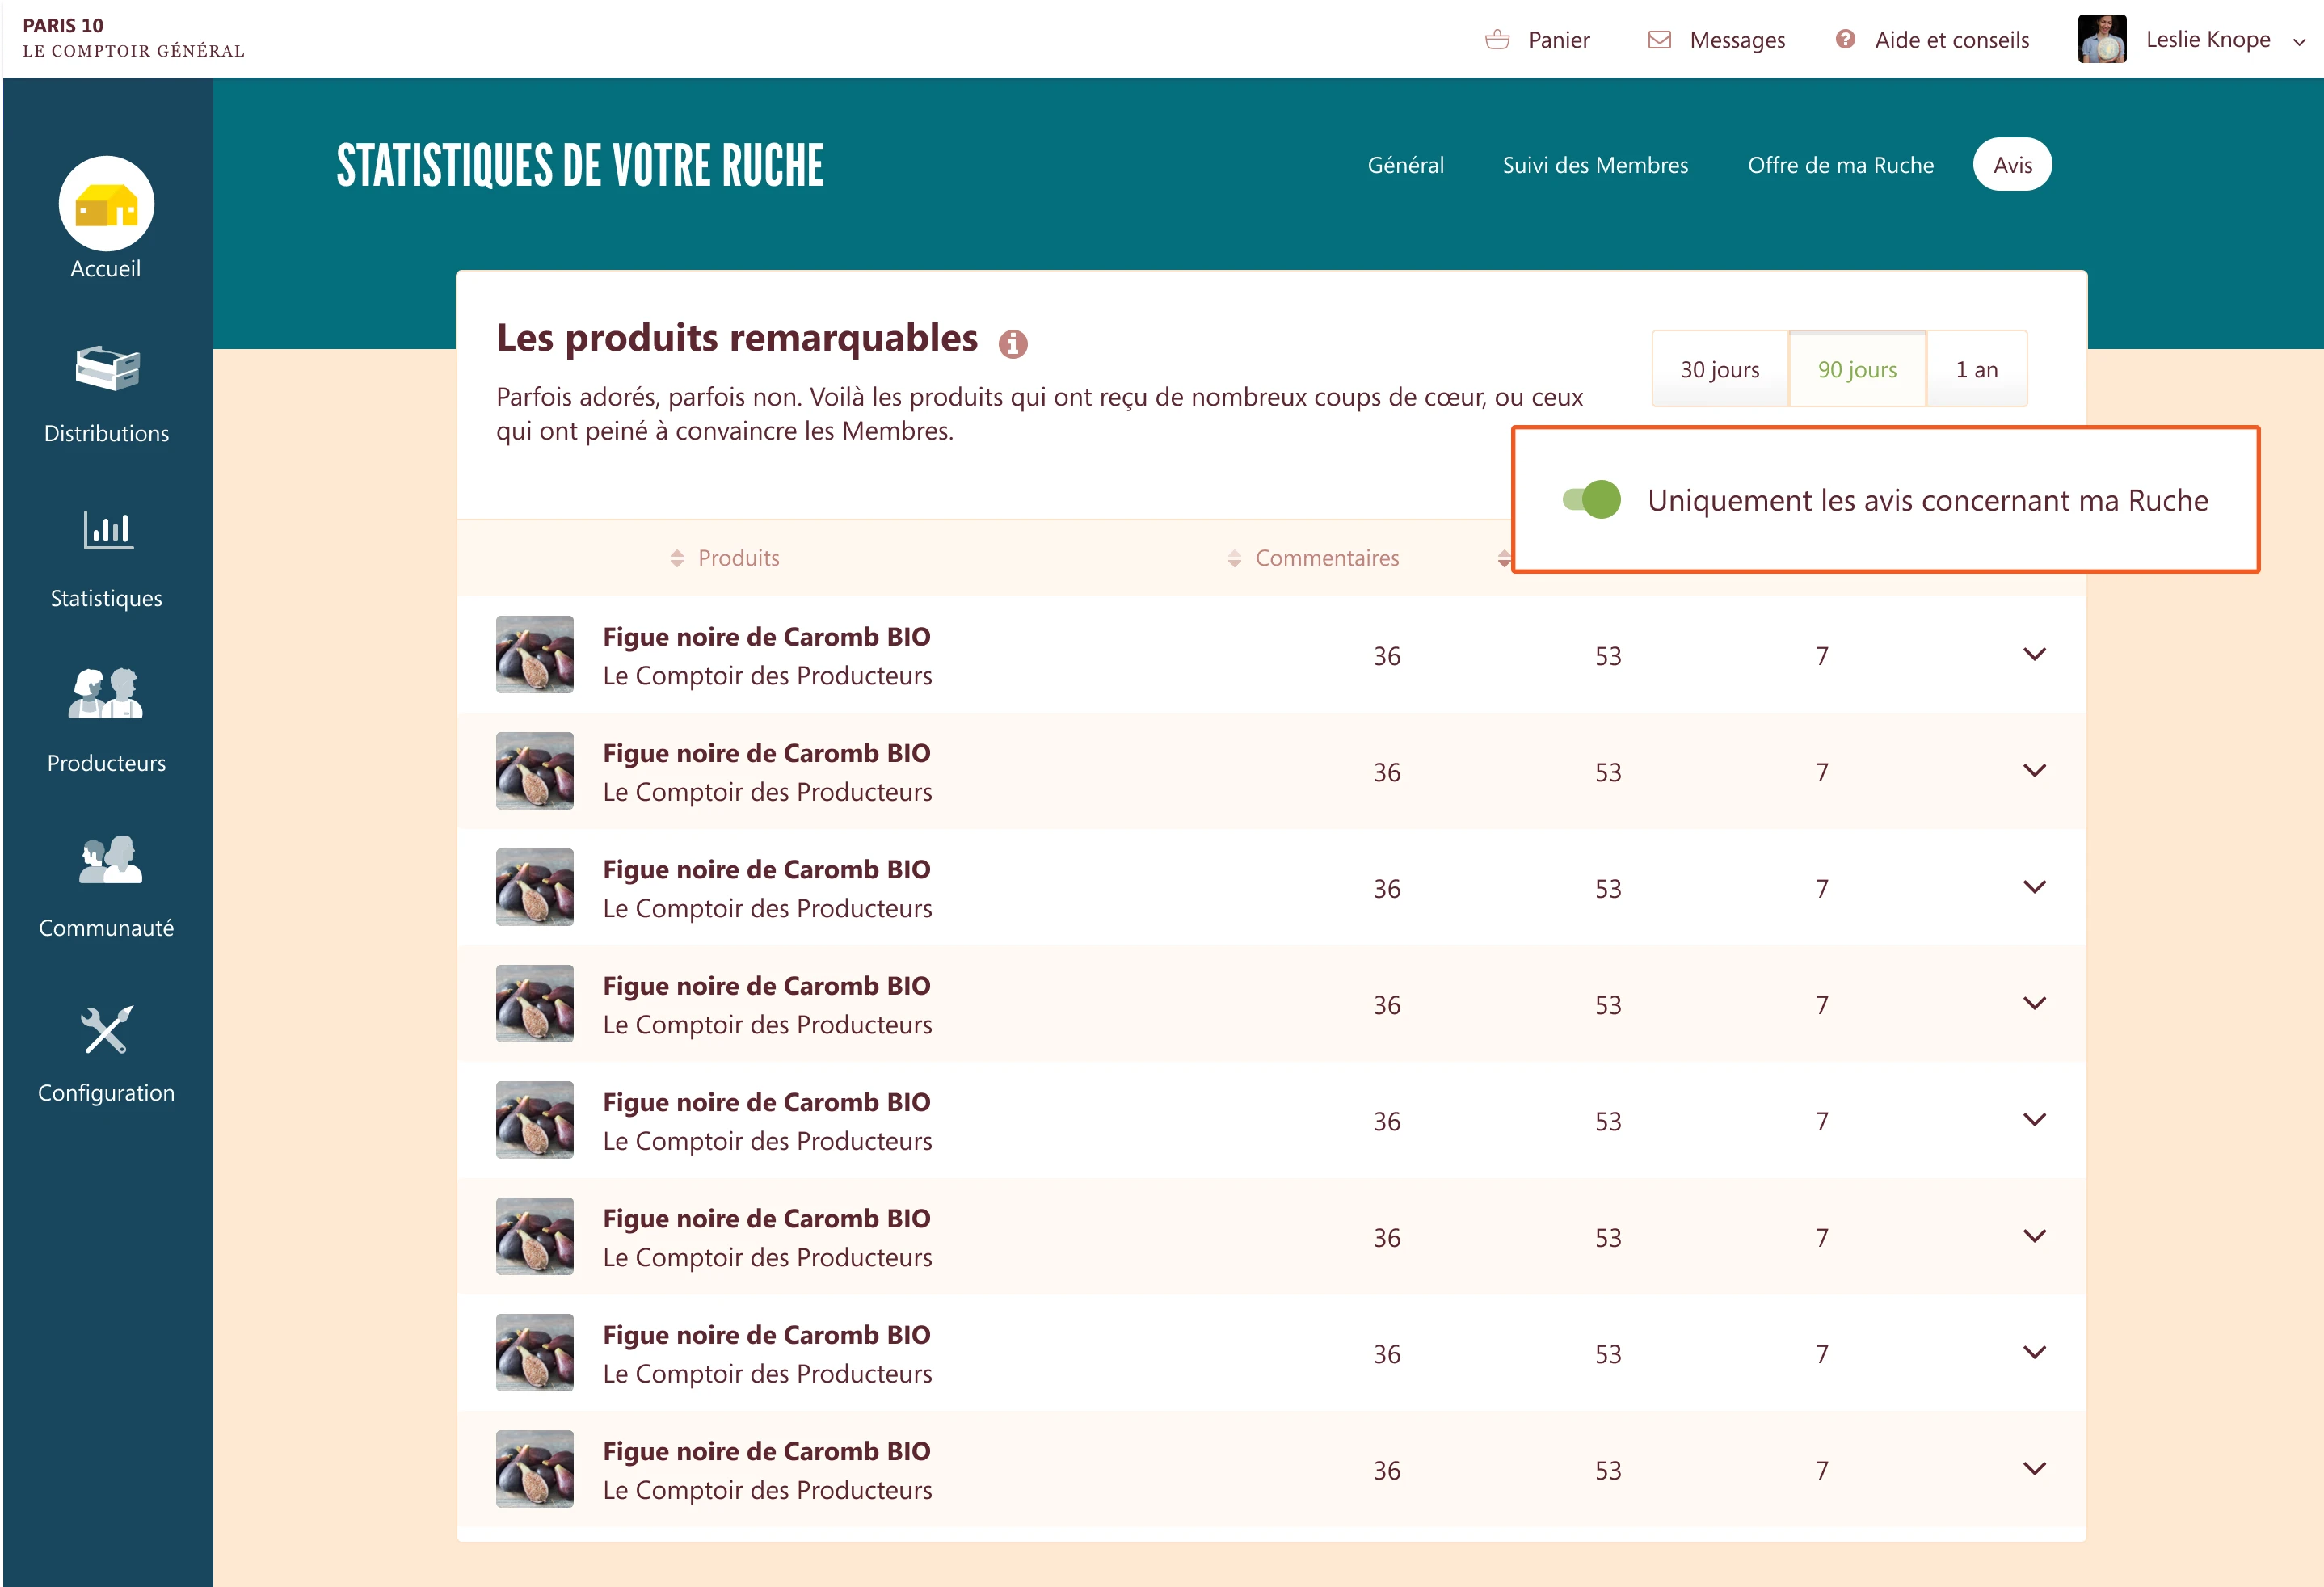
We added a switch button filter to display only reviews concerning their Ruche and a real-time notifications when new reviews are posted.

Screenshot of the “Hive statistics” dashboard featuring a bar and line chart comparing the Hive’s turnover to the average of similar Hives, with time period tabs (Month, Semester, Year).
Mobile screenshot of the “Hive statistics” module showing average turnover per distribution in a bar chart, with period filters (month, semester, year).

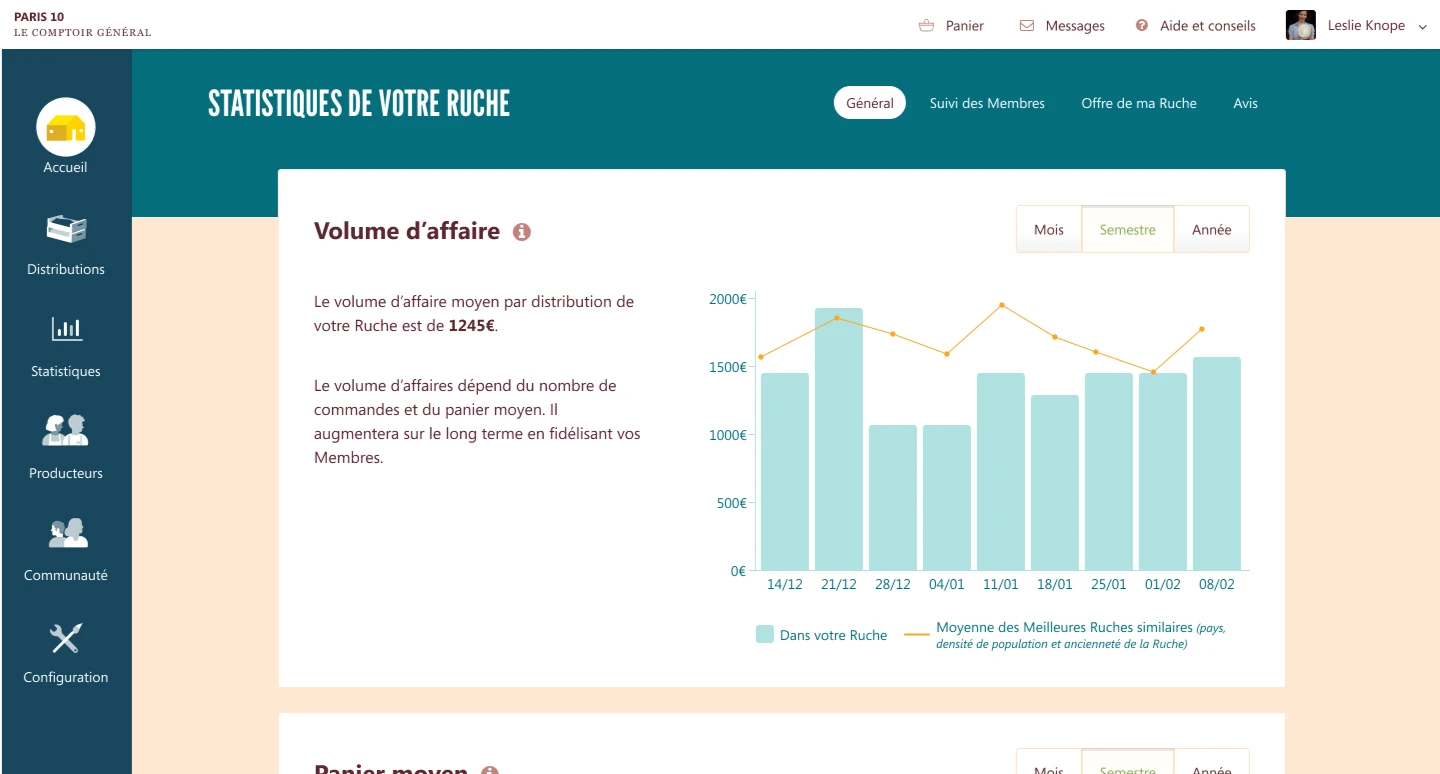
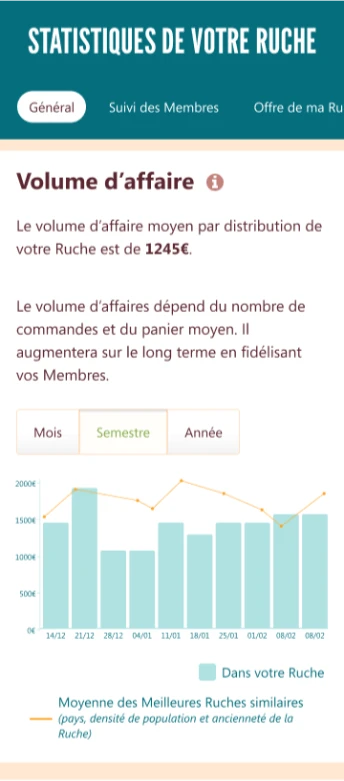
Extended data periods.

  • Option to switch data display between month/semester/year views.


  • When selecting "year," the chart switches to a monthly view instead of a distribution view.

  • Added percentage breakdowns for better clarity


  • Update colors to clearly differentiate each data item

Screenshot of the basket breakdown section, showing the percentage and average cost of each category (Fruits & Vegetables, Dairy, Meats, etc.), with an example, and tips.
Screenshot of the basket breakdown section featuring a horizontal bar chart by category (Fruits & Vegetables, Dairy, Meats, etc.), showing an average spending per Member and tips.

By conducting user research and prioritizing solutions, we redesigned the statistical tools for La Ruche Qui Dit Oui, enabling Hosts to access actionable insights.

By conducting user research and prioritizing solutions, we redesigned the statistical tools for La Ruche Qui Dit Oui, enabling Hosts to access actionable insights.

By conducting user research and prioritizing solutions, we redesigned the statistical tools for La Ruche Qui Dit Oui, enabling Hosts to access actionable insights.

Photo of two adults and two children picking up local products at a La Ruche Qui Dit Oui! distribution, filling canvas bags.

Need help shaping your idea?

Let’s Work Together!

Need help shaping your idea?

Let’s Work Together!